


Table of contents
No headings in the article.
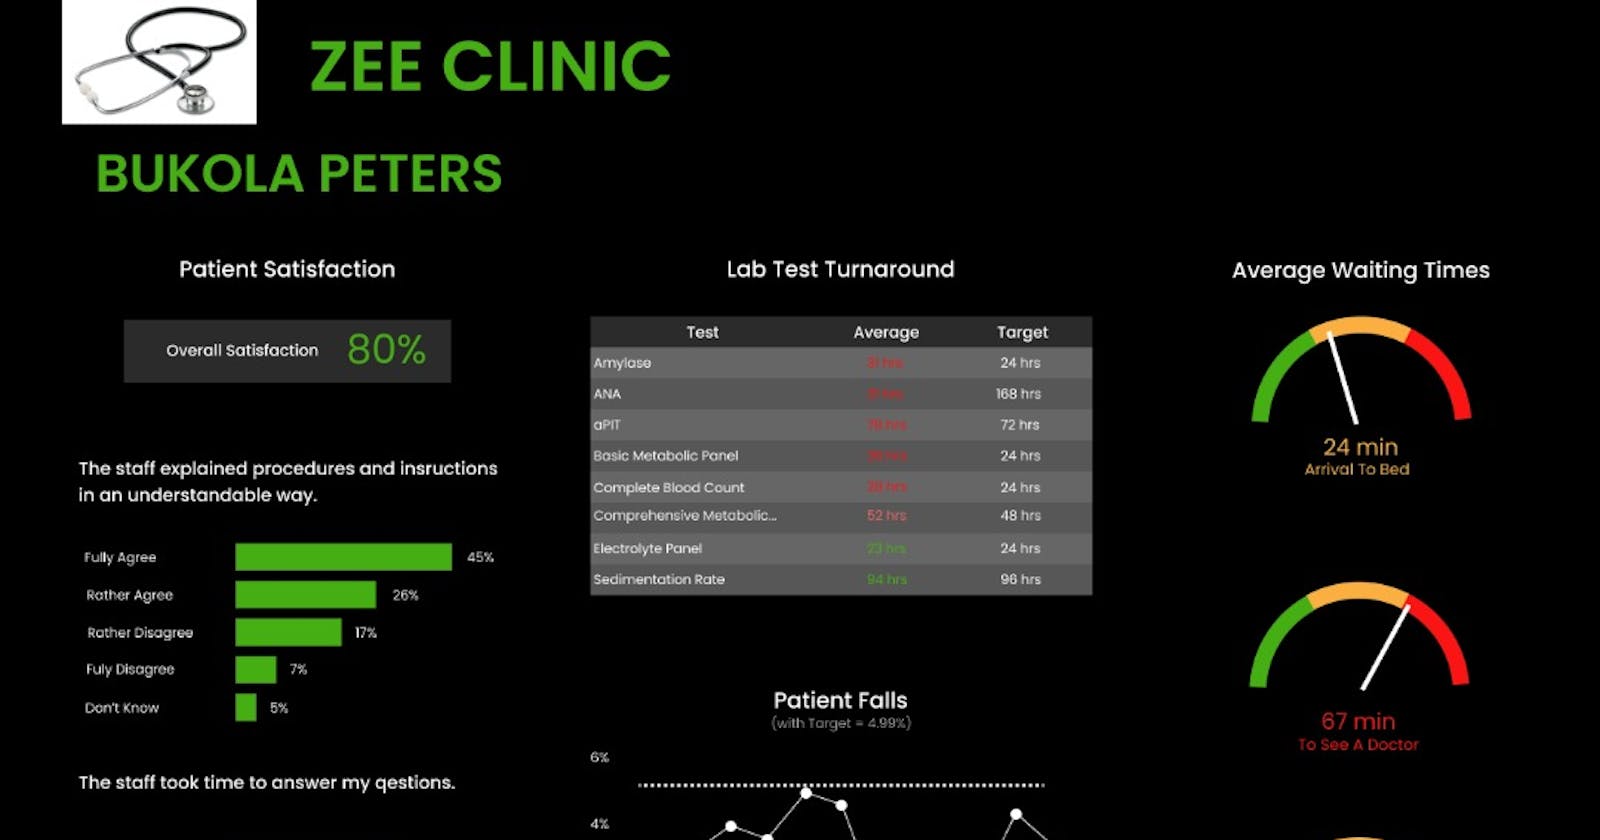
PROJECT TITLE: Health Monitor Analystics Dashboard
PROJECT OVERVIEW
As information and Data frameworks continue to grow as a fundamental resource in about each aspect of business in health, the need for dashboards to supply visibility and understanding into the execution of your frameworks is more noteworthy than ever.
Zee Clinic health monitor dashboard provides health information about patients and makes it possible to detect problems and progress of a patient, and provide alerts about issues that could impact the performance.
DURATION: June 20, 2022 to June 25, 2022.
TOOL: Figma to design, Figjam to brainstorm and ideate
RESEARCH
Detailed competitive analysis was carried out on the Zee Clinic monitor dashboard. Competitors determine their major weaknesses and strengths using Google Analytics and GigaVUE‑FM.
Secondary research was based on articles written by individuals and groups. The research was conducted to understand the problems users face when data about patients are not analyzed well. Also, to understand how to detect the problems of patients and provide services. We conducted the research to facilitate the monitoring of patients and their recovery process.
PROBLEMS AND SOLUTIONS
Problems
• Inability to detect health problems as soon as possible.
• Cannot understand patient health information and progress.
Solutions
• Have access to health services providers who manages your health progress.
• Analyze your health data and information.
• Prepare a proper understanding of patient health performance.
DESIGN PROCESS
Empathize:
Information was gathered from Secondary research , user research and competitive analysis to understand users' needs and provide solutions to it.
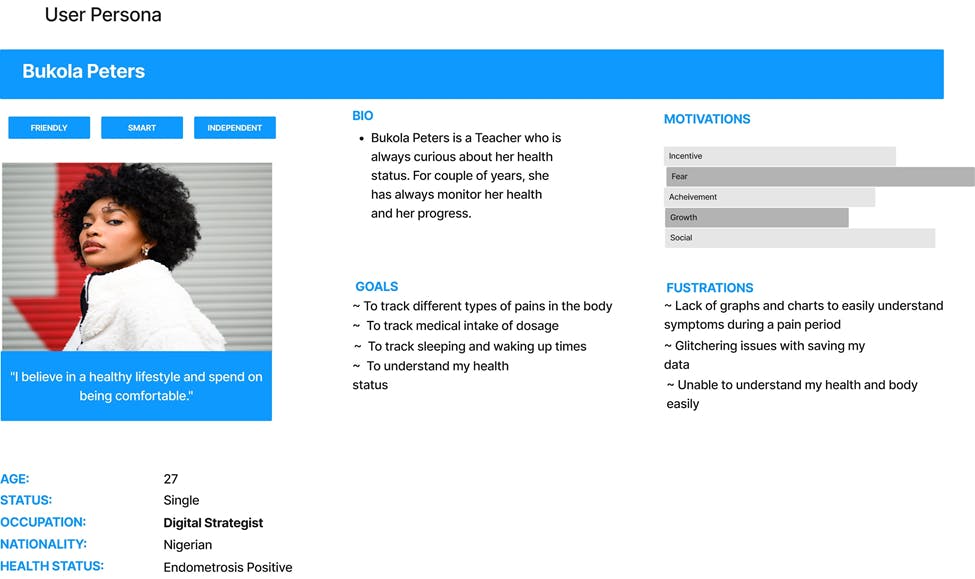
Define:
After gathering our users' needs, their problems, and our insights, we were able to come up with a creative brief, built with both strategic focus and creative inspiration to unlock the best solutions. Persona is used.
Ideate:
We challenged assumptions and created ideas for innovative solutions.
Prototype:
The design was just a dashboard which didn’t require a prototype but some interactions were created.
Test:
After the preliminary review of the designs, all its shortcomings were identified and improvements were proposed for better user interaction and visual components.
A light and dark theme has also been developed with smooth, light and clean colors that help not strain the eye and increase the duration of the session on the platform.
PORTFOLIO UI/UX TEAM 12 MEMBERS
• Uramu Stephen
• Peter Oyetunji
• Esther Adewale
• Seyi Peter
• Falegan Gbenga
• Precious Ene-Etuk
• Favour Ezenwa
• Daniyan Olayemi
• Zuleikha Usman
• Raji Kanyinsola
• Khadijah Olanrewaju
Link to the Figma